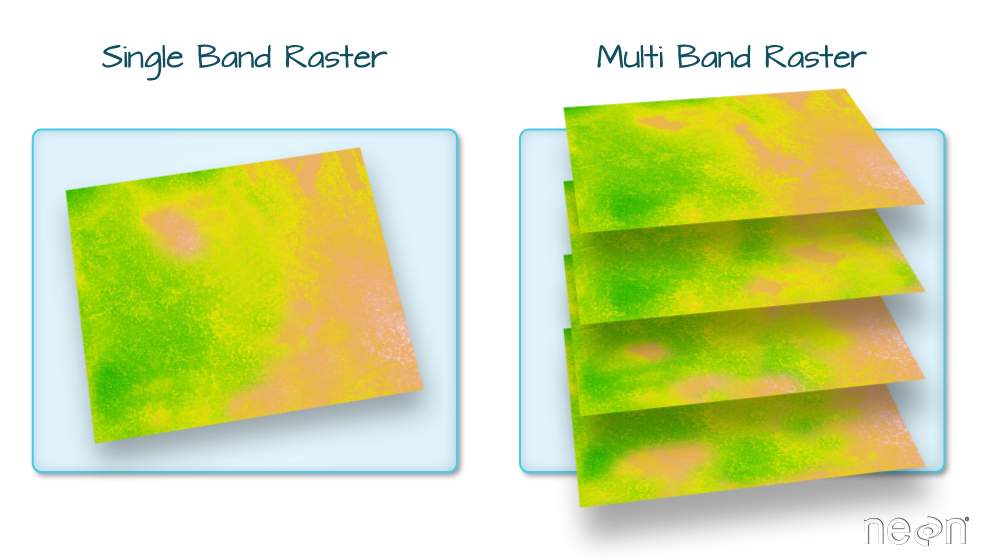
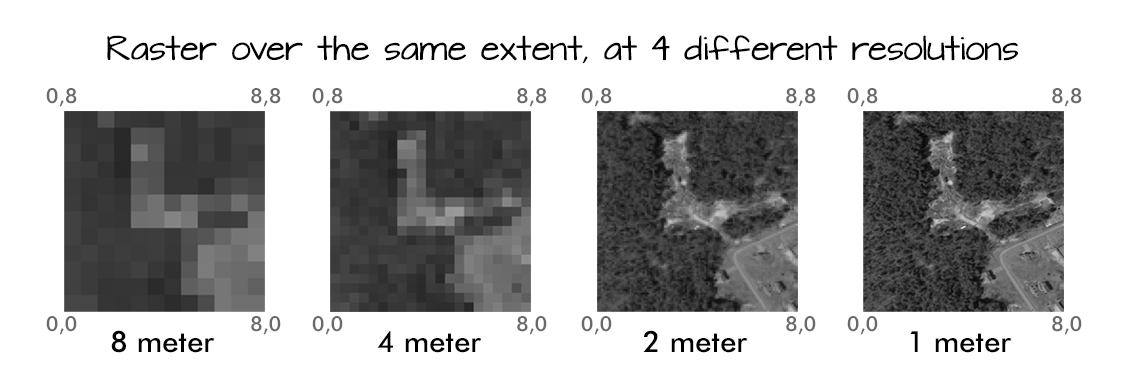
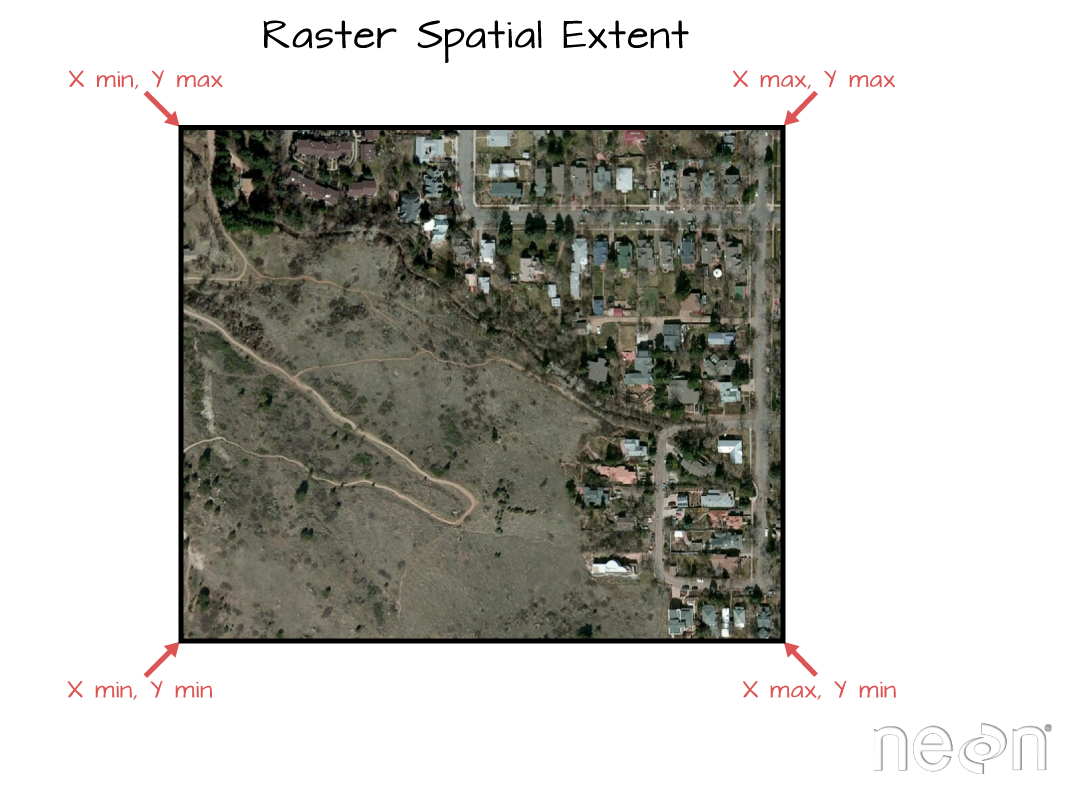
class: center, middle, inverse, title-slide # Intro to spatial analysis in R ### Susy Echeverría-Londoño and Drew Kerkhoff --- class: inverse, center, middle # Rasters --- # What is a raster? **"Gridded" data that represents areas on the Earth's surface as pixels.**  .footnote[ Source: National Ecological Observatory Network (NEON) ] --- class: center <img src="http://www.neonscience.org/sites/default/files/images/dc-spatial-raster/raster_concept.png" style="width: 80%"/> .footnote[ Source: National Ecological Observatory Network (NEON) ] --- # Spatial resolution The size of each cell (usually meters)  --- # Spatial extent X, Y coordinates of the corners of the raster in the geographic space  --- class: center # Projection Information The way the data are "flattened"" in into a 2D space. <img src="./figs/projections_example.png" style="width: 60%"/> --- class: center # Projection Information **"If you have the same dataset saved in two different projections, these two files won't line up correctly"** <img src="./figs/USMapDifferentProjections.jpg" style="width: 70%"/> .footnote[ Source: National Ecological Observatory Network (NEON) ] --- class: center # Coordinate Reference System x and y coordinate space associated with the projection. <img src="./figs/projections_example_2.png" style="width: 50%"/> .footnote[ Source: Maning Sambale ]