class: center, middle, inverse, title-slide # Dimensions of biodiversity ### Susy Echeverría-Londoño and Drew Kerkhoff --- background-image: url(https://mir-s3-cdn-cf.behance.net/project_modules/max_1200/277ac317933056.5603d258654c2.jpg) background-position: 50% 50% class: center,middle, inverse # Measuring biodiversity Image credit: Angélica Montes --- class: center # Biodiversity indices  Richness, Eveness, Composition .footnote[ Purvis & Hector, 2000. Nature ] --- class: center # Biodiversity measures <img src="./Figs/Halffter_Ros_Fig1.png" style="width: 50%"/> Spatial sampling <img src="./Figs/biodiv_habloss_fragment.jpg" style="width: 50%"/> .footnote[ Halffter & Ros, 2013 ] --- class:center # Biodiversity measures <img src="./Figs/Hill_etal_ConsLett.png" style="width: 80%"/> Temporal sampling .footnote[ Hill et al., 2016 ] --- class:center # Alpha and Beta diversity <img src="./Figs/VanderPlas_etla_2016.png" style="width:50%"/> .footnote[ van der Plas et al., 2016 ] --- class:center # Expectation vs reality <img src="./Figs/Halffter_Ros_Fig2.png" style="width: 80%"/> .footnote[ Halffter & Ros, 2013 ] --- class:center, middle # Expectation vs reality  .footnote[ Kissling et al, 2017 ] --- class:center # Diversity metrics .left-column[  ] .right-column[  ] --- background-image: url(https://mir-s3-cdn-cf.behance.net/project_modules/max_1200/277ac317933056.5603d258654c2.jpg) background-position: 50% 50% class: center,middle, inverse # How many species are there? Image credit: Angélica Montes --- class:center # How many species are there? 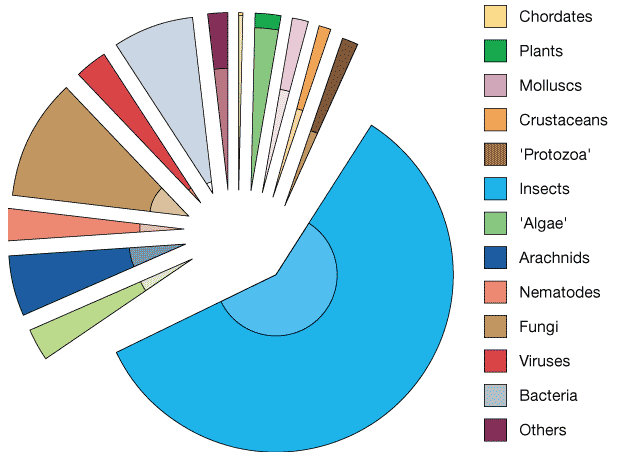 .footnote[ Purvis & Hector, 2000 ] --- class:center # How many species are there? .left-column[  ] .right-column[ 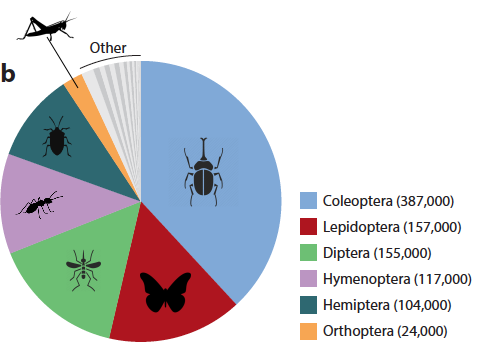 ] .footnote[ Purvis & Hector, 2000; Stork, 2018. ] --- class:center # How many insects are there? <img src="./Figs/Stork_etal_fig1.png" style="width: 70%"/> --- class:center, middle # How many insects are there? <img src="./Figs/Stork_etal_fig3.png" style="width: 100%"/> .footnote[ Stork et al., 2016. ] --- class:center, middle # Spatial bias in the accumulation of new species <img src="./Figs/Edi_etal_2017.png" style="width: 60%"/> .footnote[ Edi et al., 2017. Marine bivalves example ] --- class:center, middle # Species concept and delimitation <img src="./Figs/Figure-2-The-general-lineage-unified-species-concept-adapted-from-de-Queiroz-1998.png" style="width: 70%"/> .footnote[ Queiroz, 1998 ] --- class:center, middle # Species concept and delimitation <img src="./Figs/Faurby_etal_2016.png" style="width: 70%"/> .footnote[ Faurby et al., 2016 ] --- background-image: url(https://mir-s3-cdn-cf.behance.net/project_modules/max_1200/277ac317933056.5603d258654c2.jpg) background-position: 50% 50% class: center,middle, inverse # The phylogenetic era Image credit: Angélica Montes --- class:center # Temporal and topological patterns <img src="./Figs/McGuire_etal_2014.jpg" style="width: 70%"/> .footnote[ McGuire et al., 2014 ] --- class:center, middle # Phylogenies and biodiversity measures <img src="./Figs/HumphreysBarraclough2014.png" style="width: 100%"/> .footnote[ Humphreys & Barraclough, 2014 ] --- class:center # Phylogenies and biodiversity measures <img src="./Figs/phylogenetic_diversity.jpg" style="width: 50%"/> .footnote[ Brent Mishler/UC Berkeley ] --- background-image: url(./Figs/New_zealanda.jpg) background-position: 50% 50% class: center,middle, inverse # Human impacts on biodiversity Image credit: Mont Egmont, New zealand. CNES 2004 to 2011, Distribution Airbus DS --- class: center,middle, inverse <img src="https://media.koreus.com/201703/mont-taranaki.jpg" style="width: 60%"/> --- class: center # The "great acceleration" <img src="./Figs/Living_index_planet_report.png" style="width: 50%"/> --- class: center # Major declines in abundances and populations <img src="./Figs/Dirzo_etal_2014_Fig1.png" style="width: 50%"/> .footnote[ Dirzo et al, 2014 ] --- class: center # Non-random extinctions <img src="./Figs/Dirzo_etal_2014_Fig2.png" style="width: 60%"/> .footnote[ Dirzo et al, 2014 ] --- background-image: url(https://mir-s3-cdn-cf.behance.net/project_modules/max_1200/277ac317933056.5603d258654c2.jpg) background-position: 50% 50% class: center,middle, inverse # Main challenges Image credit: Angélica Montes --- class: center # Biodiversity is more than birds .left-column[ 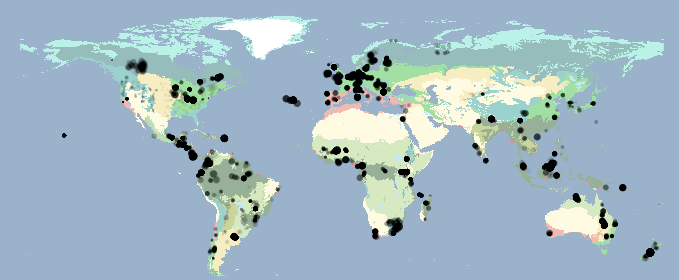 ] .right-column[ 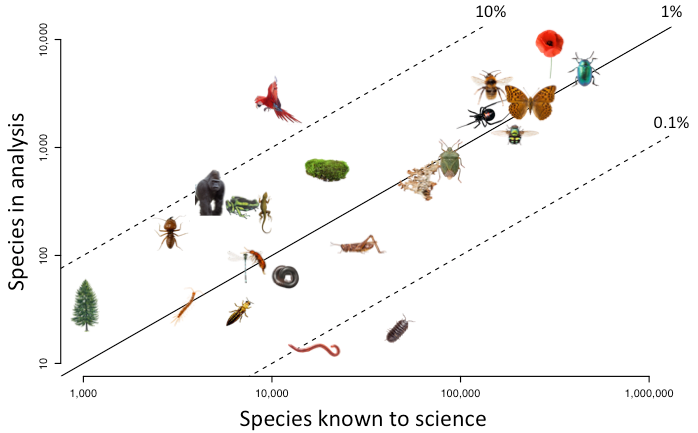 ] .footnote[ Hudson et al., 2015. The PREDICTS project ] --- class: center # More than counting  .footnote[ Dirzo et al, 2014 ] --- class: center # Evolutionary legacies  Distribution and responses to changes .footnote[ Cavender-Bares et al, 2016 ] --- class: center, middle, inverse # Conclusion --- class: center # Biodiversity is multidimensional <img src="./Figs/Naeem_etal_2016.png" style="width: 50%"/> .footnote[ Naeem et al, 2016 ]